Wednesday, November 11, 2009

Space-Time Research releases "The KML Cruncher"

Today Space-time Research submitted the KML Cruncher as an entry to the Mashup Australia contest under the “Additional Transformation Challenge – Opening Up Government Data Sets” section. It’s a utility that converts and generalises ESRI polygon shape files into KML ready for the web, useful for those people who quickly want to move from the shape file format into KML for web mash ups without the fuss of obtaining heavy weight GIS systems.

Using the utility is easy - here’s an example of how to convert an ESRI polygon shape file to a KML file ready for the web:

1) Firstly obtain the shape file you would like to convert and save it to a local drive – there are many example shape files at http://data.australia.gov.au , for this example we will be using the ‘Drainage Basins Queensland’ dataset available at http://data.australia.gov.au/134. Note, this utility works with polygon shape files only, so make sure you obtain a shape file that contains polygons (also referred to as ‘boundaries’). The ‘Drainage Basins Queensland’ dataset is archived in a .zip file, so make sure you extract it to your local drive before continuing.

2) Now you’re ready to convert your shape file, click on the ‘Browse’ button next to the ‘Choose a shape file (*.shp):’ text box and choose the *.shp file from your local hard drive. In this example we will be using the ‘Drainage Basins Queensland’ dataset at http://data.australia.gov.au/134, so we will choose ‘IQATLAS.QLD_DRNBASIN_100K.shp’.

3) Click on the ‘Browse’ button next to the ‘Choose a dbf file (*.dbf):’ text box and choose the associated *.dbf file. We must specify the *.dbf file that is associated with the *.shp file we chose in step 2), so we will choose ‘IQATLAS.QLD_DRNBASIN_100K.dbf’ file.

4) Next we’d like to specify a label field. The label field is used as an identifier for each of your converted polygons – once in KML format this is what will be shown in the information window when you click on a polygon. This field is optional, if you do not specify it, the utility will take the first field it finds. If you would like to know what fields are available in your .dbf file you can open it using Microsoft Excel, or if you’d like to inspect the data further before converting, try ESRI’s ArcExplorer product. For this example I’ll be setting the label field to: BASIN_NAME

5) Next we will specify a generalisation tolerance. In a nutshell the generalisation tolerance is a measurement between polygon vertices, if this tolerance is exceeded, one of the vertices will be removed. Generally you will need to specify a larger tolerance for more detailed data sets. It’s likely that you will have to convert the shape file a few times to get the right tolerance, luckily I’ve had a bit of time to play with it, so I will specify 0.005 as the tolerance.

6) Hit the convert button, wait patiently and you will have a nicely generalised KML file ready to serve on the web!

Here's a screen shot of the ‘Drainage Basins Queensland’ dataset transformed at a tolerance of 0.005, shown in Google Earth.
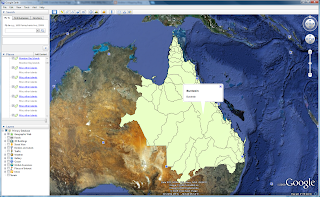


Also for the developers – this is a simple HTTP post action from a WEB form (nothing fancy) therefore it could easily be used as a web service…


-A

Sunday, July 12, 2009

The Auto Correlation Engine

Hello welcome to my blog, this is the first post, and it's going to be about what I'd like to call the Auto Correlation Engine.

An idea came to me after viewing this article.

Say you had a bunch of data, and I'm not talking a couple of spreadsheets, I'm talking tens of millions of records, each holding attribute information... so much data you literally don't know what to do with - like perhaps all the information collected by governments around the world in their yearly census. It's too big to simply browse through to find out any useful information and there's too many geographic layers to add into a G.I.S to do any manual spatial analytics on it. But you know there's gold in the data somewhere. You know there must be some correlation between separate observations.

Enter the Auto Correlation Engine.

Imagine you had a system where by, for each geographic layer (State, Suburb, Region, Census District, etc, etc) you could attach a predefined observation (e.g, count, percentage, calculation) and derive all the possible spatial correlation indices amongst the observations, and report them to you.

E.G:

Let's say your a government employee in charge of deciding what to do next about the high rates of child obesity in your district. Naturally as a G.I.S user you decide to add a new layer to your system displaying the count (and the lat/long points perhaps using proportional symbols) of obese children in your district. But what next? Do you add the fast food restaurants and perhaps do some concentric ring analysis? Do compare it with a layer displaying the number of game consoles bought in the area?

What if, you had a system that had already found out, for that layer, what other geographic layers and associated attributes have a high correlation index. As soon as you added the child obesity rates to your G.I.S platform, the Auto Correlation Engine would have predetermined that there is a correlation between high child obesity rates and the number of parks in the area, and informed you of the correlation. It would then ask you if you would like to add the correlated layer to your map. Of course it wouldn't be one of those annoying Microsoft paperclips, but it might be useful.